
 Much to my delight, I recently stumbled onto an excellent article by THT’s Matt Binder contemplating league spending from 2001-2010. As you’re probably aware, the Yankees’ accomplishments over the past decade tend to reflect quite favorably when compared against the rest of Major League Baseball. After assessing the trends, Matt affirms:
“In each of the past 10 years, the teams that have spent the most on payroll in their division, or the second-most, have made the playoffs 49 times—27 times in the American League and 22 times in the National. During the same time, the bottom two teams in payroll spending have made the playoffs 16 times; 11 in the American and five in the National. … In conclusion, spending a lot of money is [generally] good for your team’s record.”
Given the polarizing nature of MLB’s drastic disparities in spending and the Yankees’ reputation of being the financial juggernaut that continues to exasperate the condition, I thought it’d be fun to repeat Matt’s exercise during the 1990s. By examining spending during New York’s most recent dynasty years, perhaps we’ll be able to determine if the league was more financially equivalent back then, and if it was, whether that yielded more equitable results.
The American League East
Average percentage of league mean: 127%
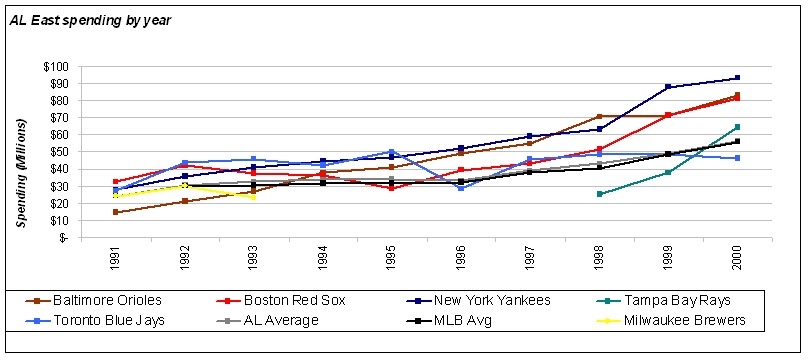
During the 1990s, each member of the AL East (with the exception of the Brewers who I’ll be discussing a bit later) followed a fairly linear upward trend that both demonstrated the division’s ever-increasing competitiveness and the developing financial inequality that would increasingly engulf the rest of baseball. As to be expected, most teams in this division operated well above MLB average spending; cumulatively the group catapulted past league average at a rate of 127%. Obviously, this made the Devil Rays’ transition into the league as an expansion team challenging for the first few ten seasons or so — but then again, no one said contending perennially with Big Stein’s Bombers would be a cakewalk.
Under Steinbrenner’s tutelage, the Yankees significantly hovered above the other teams in spending, even doubling the Rays’ spending by the year 2000. From 1991 to 2000, the Yankees payroll simply climbed every year at what seemed liked an exponential rate. By the time the decade drew to an end, the Yankees’ spending had risen over 300% ($92.9M in 2000) since the start of the decade coinciding with six postseason appearances and three World Championships. Of course, these values appear rather pedestrian nowadays as that type of money is allocated to literally a handful of guys wearing pinstripes (that means you too, ).
What I find particularly interesting about this timeframe though, is it signifies a period where the Orioles were actually “plus spenders” in relation to the league mean, and the Red Sox were largely a footnote in overall success despite maintaining a competitively operating franchise in terms of payroll (in addition to notching three postseason appearances).
The American League Central
Average percentage of league mean: 87%
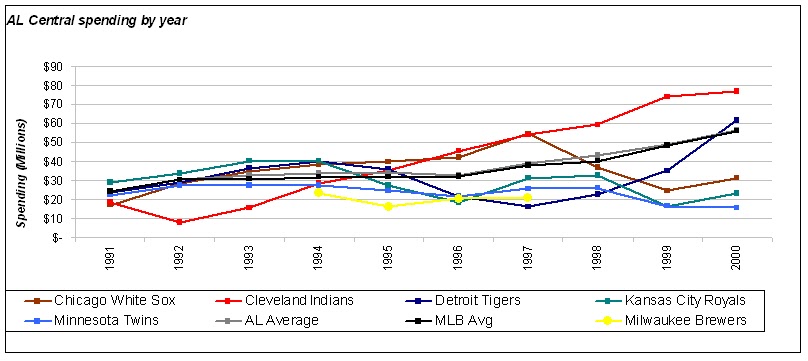
The AL Central isn’t quite so neatly organized in terms of overall trending and was the lowest-spending division on average, with the Indians being the only the team consistently outspending the league mean. What’s even more incredible though, was how the Indians operated in contrast to the rest of the teams in the grouping.
The MLB average spending from 1991-2000 was approximately $31.3M. From 1996-2000, the Indians spending spiked dramatically above the MLB mean and hovered around $61.8M. Although a World Championship was never in their cards, they did manage to obtain five postseason appearances (one climaxing in a 4-2 World Series defeat to the Braves), and were clearly the dominating force in the AL Central during the latter half of the decade both fiscally and statistically. On a slightly derisive note, it’s also the last time I remember a Cleveland baseball team upholding sustained success in my lifetime.
During the 1994-1997 seasons, the Brewers were reassigned to the AL Central. During this time span the MLB spending average was approximately $33.2M. The Brewers countered with a payroll approximately 60% that amount averaging approximately $20.2M during those years. By this point, MLB was in a state of flux in terms of divisional alignment. Once 1998 rolled around, Bud Selig had the team repositioned once more to their current residence, the NL Central.
The American League West
Average percentage of league mean: 100%
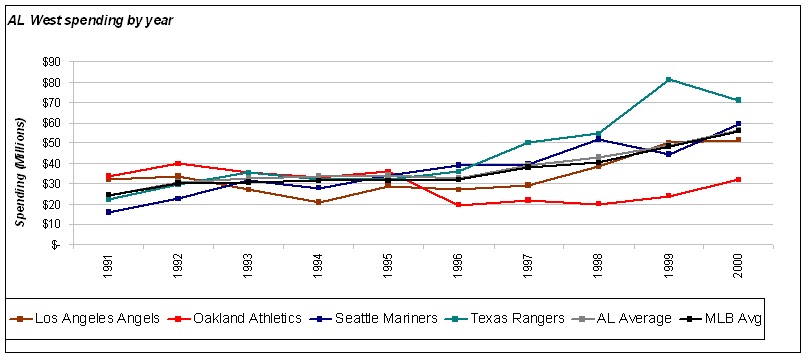
The AL West essentially mirrored the trending of the rest of baseball. The only real fluctuations were those of the Rangers and Athletics which basically offset each other in terms of cumulative spending totals. During the 90s the Rangers were spending an average of $44.5M with substantial spikes in 1999 and 2000 ($81.3M and $70.7M, respectively) on players like , Ruben Sierra, , , Kevin Brown, , Juan Gonzalez, and .
Around 1996, the Athletics began their descent into frugality which eventually led to their mystical-financially-prudent-sabermetric-approach-to-survival otherwise known as Moneyball, while (who would later cripple Texas’ checkbook) was still categorized in the major-production-at-an-only-moderately-expensive-cost column for Seattle. These three teams netted eight postseason appearances while the then-hapless Angels (who would decidedly turn it around in the 2000s) idled in the world of relatively cheap mediocrity.
The National League East
Average percentage of league mean: 92%
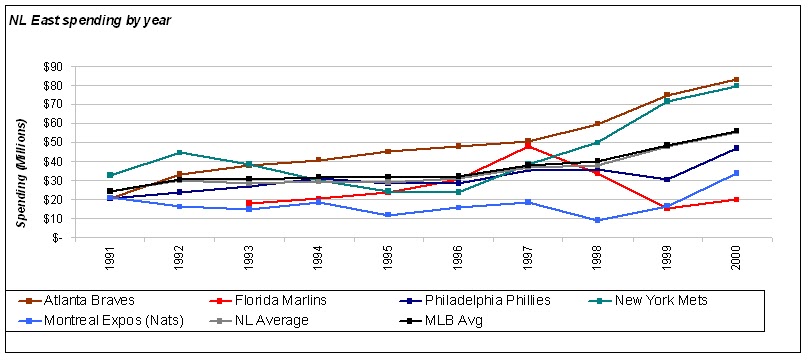
The Braves’ dominance of the decade was unsurprisingly underscored by a willingness to spend. In a division that spent an average of $33.3M, or 92% of MLB mean spending, Atlanta consistently went above and beyond. From 1992 through the remainder of the decade they averaged $52.5M, topping out at $82.7M in 2000. During that time, the Braves accumulated nine postseason appearances and a World Championship in 1995. Given the effectiveness of Atlanta’s out-of-this-world rotation stewarded by , , and , I can only imagine the angst experienced by fans of NL teams not hailing out of Georgia. What I can imagine, though, are the feelings inspired by one team who did manage to beat the pride of NL East when it counted most, on multiple occasions, mind you (sorry, too much?).
Meanwhile, the Montreal Expos’ spending maintained a fairly consistent level of “pitiful” as it rested at approximately $17.5M. The cost of a skinflint-oriented operation was zero postseason appearances and increased motivation to relocate.
The Marlins, on the other hand, while largely operating under MLB average at approximately $26M, at least had the excuse of being a newly founded franchise (which would then have to compete with another Florida-based team later in the decade). However, there was that exceptional 1997 season when Florida was freakishly good, resulting in a World Series Championship at the inflated cost of $47.7M in expenses (nearly doubling their average up until that point).
The National League Central
Average percentage of league mean: 92%

Unfortunately, the NL Central left quite a bit to be desired as it typically does. The division averaged 92% of the league’s mean spending, and the results were mostly unmemorable. The paltry Pirates matched expectations as they fulfilled their most-likely-to-quit-baseball-and-try-a-new-sport superlative. They averaged a $21.1M payroll over the course of the decade which was weighed down by a measly $9.1M in 1997. To really put 1997 in perspective, the top-spending Reds outspent the Pirates by $37.1M. Although Pittsburgh did have playoff appearances in 1991 and 1992, they also eventually morphed into the organization boasting the most consecutive losing seasons (18 and counting!) thus disgracing a typically well represented sports town.
As for the Reds, they primarily spent the most dollars in the quest for divisional supremacy before ultimately being usurped by the Cubs in 1998. These two lousy teams managed a combined postseason appearance total of two over the course of 10 years and demonstrated fine examples of generally inept organizational execution (perhaps matched most closely by the current rendition of the Mets).
The National League West
Average percentage of league mean: 107%
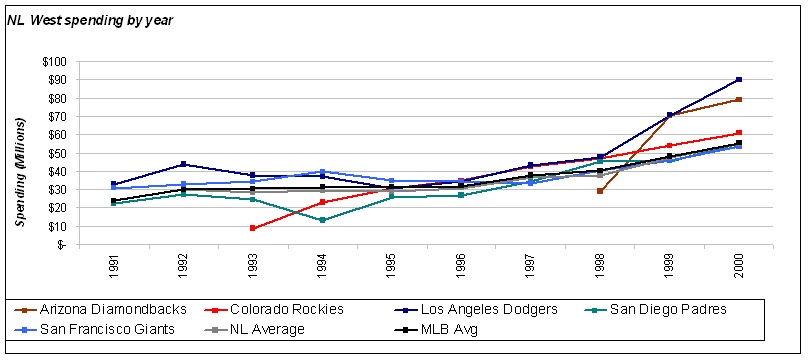
The NL West displays the most consistency of any of the divisions in terms of trending. Communally, the NL West’s dollars spent ($38.8M) averages slightly above league average. This is especially impressive as it contained two new teams (the Rockies and Diamondbacks) who both veered away from Tampa Bay’s try-to-get-ballplayers-to-play-for-free business model.
The Dodgers were fairly steadfast in leading the league at $46.9M, although in the final two years surveyed, their total spiked rather precipitously (thanks in large part to and NY “fan-favorite” Kevin Brown). Unfortunately for the LA faithful, the team had relatively little to show for it. Thankfully, the Padres, who were fourth in total spending, were content in taking the majority of losses over the course of these years, and graciously accepted/embraced their one playoff appearance.
The Diamondbacks came out of the gates aggressively in 1999 (their second season as a franchise) with a payroll surpassing the $70M plateau and were rewarded with an NLDS thrashing compliments of the Braves. Since then, their big spending sustainability has dwindled given the limitations of their market.
Division vs. Division
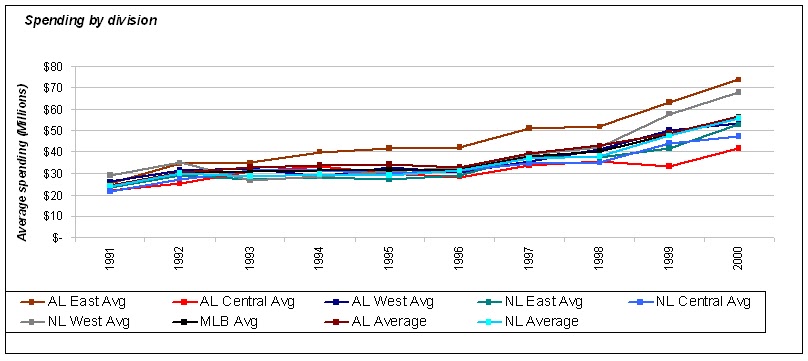
All in all, the AL East completely overshadowed the rest of baseball in spending during the Yankees’ late ‘90s glory years, and the Bombers generally overshadowed their competition in both spending along with results. It is important to remember though, that during this decade, the league was changing.Technically, the intraleague divisions weren’t established until 1994 when the National League was expanded to 14 teams (and interleague play didn’t begin until 1997).
While big money never guarantees anything, it clearly worked to Steinbrenner’s advantage during this period. Consider the weighted averages of dollars spent against the league average over the years.
| New York Yankees | 1.484 | (1st in division, 6 playoff appearances) |
| Atlanta Braves | 1.324 | (1st in division, 9 playoff appearances) |
| Los Angeles Dodgers | 1.271 | (1st in division, 2 playoff appearances) |
| Boston Red Sox | 1.263 | (2nd in division, 3 playoff appearances) |
| Baltimore Orioles | 1.234 | (3rd in division, 2 playoff appearances) |
| Toronto Blue Jays | 1.212 | (4th in division, 3 playoff appearances) |
| Texas Rangers | 1.187 | (1st in division, 3 playoff appearances) |
| New York Mets | 1.167 | (2nd in division, 2 playoff appearances) |
| Chicago Cubs | 1.099 | (1st in division, 1 playoff appearance) |
| Cleveland Indians | 1.077 | (1st in division, 5 playoff appearances) |
| Cincinnati Reds | 1.076 | (2nd in division, 1 playoff appearance) |
| San Francisco Giants | 1.075 | (2nd in division, 2 playoff appearances) |
| St. Louis Cardinals | 1.018 | (3rd in division, 2 playoff appearances) |
| Chicago White Sox | 0.996 | (2nd in division, 2playoff appearances) |
| Seattle Mariners | 0.995 | (2nd in division, 3 playoff appearances) |
| Los Angeles Angels | 0.941 | (3rd in division, 0 playoff appearances) |
| Detroit Tigers | 0.904 | (3rd in division, 0 playoff appearances) |
| Oakland Athletics | 0.882 | (4th in division, 2 playoff appearances) |
| Kansas City Royals | 0.874 | (4th in division, 0 playoff appearances) |
| San Diego Padres | 0.872 | (3rd in division, 2 playoff appearances) |
| Houston Astros | 0.867 | (4th in division, 3 playoff appearances) |
| Philadelphia Phillies | 0.859 | (3rd in division, 1 playoff appearance) |
| Colorado Rockies | 0.763 | (4th in division, 1 playoff appearance) |
| Milwaukee Brewers | 0.754 | (5th in division, 0 playoff appearances) |
| Minnesota Twins | 0.701 | (5th in division, 1 playoff appearance) |
| Pittsburgh Pirates | 0.621 | (6th in division, 2 playoff appearances) |
| Florida Marlins | 0.568 | (4th in division, 1 playoff appearance) |
| Montreal Expos (Nats) | 0.498 | (5th in division, 0 playoff appearances) |
| Arizona Diamondbacks | 0.360 | (5th in division, 1 playoff appearance) |
| Tampa Bay Devil Rays | 0.257 | (5th in division, 0 playoff appearances) |
Without ample spending, the “Core-4” may have been unable to remain intact just as the supreme pitching of Atlanta might not have been under team control for nearly as long. If anything, I also have one more reason to appreciate the Astros’ organization, as they achieved three playoff appearances despite operating under the average MLB budget and holding steadfast as the second-to-last in spending within their division — basically acting as the “Billy Beane squad” of the NL West.
For those skeptics out there, consider this. The top two teams in each American League division in terms of team payroll made the postseason 23 times. The same set of criteria yielded 19 appearances from the NL for a combined 42 total postseason opportunities. On the other hand, the two lowest spending teams from each division within the AL reached the playoffs only two times and only six in the NL combining for a measly eight total.
Granted, the ‘90s were a strange time in terms of postseason play. The 1991-1993 seasons did not have the ALDS round and there were no playoffs in 1994 altogether. With that being said, I’m not sure how drastic of a difference it would have made for the small market teams. Perhaps where an opportunity might have arisen had there been additional playoff slots would be for the “middle-of-the-pack #3” teams who were on the threshold of competing more regularly such as the Cardinals or White Sox.
Here’s a more granular breakdown.
Top two teams in payroll per year that made the playoffs:
AL East: (1992, 1993 Blue Jays) (1995, 1996, 1997, 1998, 1999, 2000 Yankees) (1996, 1997 Orioles) (1992, 1999 Red Sox)
AL Central: (1996, 1997, 1998, 1999 Indians)
AL West: (1992 Athletics) (1995, 1997, 2000 Mariners) (1996, 1998, 1999 Rangers)
NL East: (1992, 1993, 1995, 1996, 1997, 1998, 1999, 2000 Braves) (1997 Marlins) (1999, 2000 Mets)
NL Central: (1994 Reds) (1996, 2000 Cardinals) (1998 Cubs) (1999 Astros)
NL West: (1995 Rockies) (1996 Dodgers) (1999 Diamondbacks)
American League total: 23
American League total: 23
National League total: 19
MLB total: 42
Bottom two teams in payroll per year that made the playoffs:
AL East: (1995 Red Sox)
AL Central: None
AL West: (2000 Athletics)
NL East: (1991 Braves)
NL Central: (1997 Astros)
NL West: (1995 Dodgers) (1996 Padres) (1997, 2000 Giants)American League total: 2
National League total: 6
MLB total: 8
AL Central: None
AL West: (2000 Athletics)
NL East: (1991 Braves)
NL Central: (1997 Astros)
NL West: (1995 Dodgers) (1996 Padres) (1997, 2000 Giants)American League total: 2
National League total: 6
MLB total: 8
15 highest spending in relation to league average:
1. 1999 Yankees (1.830 times the league average) [World Champions]
2. 1998 Orioles (1.745) [no playoffs]
3. 1999 Rangers (1.688)
4. 2000 Yankees (1.664) [World Champions]
5. 1996 Yankees (1.631) [World Champions]
6. 2000 Dodgers (1.618) [did not make playoffs]
7. 1995 Blue Jays (1.581) [did not make playoffs]
8. 1998 Yankees (1.566) [World Champions]
9. 1999 Braves (1.559)
10. 1997 Yankees (1.556)
11. 1999 Indians (1.533)
12. 1996 Orioles (1.523)
13. 1996 Braves (1.498) [World Champions]
14. 1993 Jays (1.495) [World Champions]
15. 1999 Red Sox (1.489)
15 lowest spending in relation to league average*:
1. 1998 Expos (Nats) (0.228)
2. 1997 Pirates (0.239)
3. 1992 Indians (0.273)
4. 2000 Twins (0.280)
5. 1993 Rockies (0.289)
6. 1999 Marlins (0.315)
7. 1999 Twins (0.340)
8. 1999 Expos (0.340)
9. 1998 Pirates (0.341)
10. 1999 Royals (0.343)
11. 2000 Marlins (0.356)
12. 1995 Expos (0.382)
13. 2000 Royals (0.414)
14. 1994 Padres (0.428)
15. 1997 Tigers (0.429)
*Of the teams qualified, not one made the postseason during the respective year listed.
Suffice it to say, the numbers speak for themselves. In regard to the questions listed in my thesis above, I’d say the answers are fairly self evident.
A) Was the league was more financially equivalent back then? No, not really. While the overall dollars spent were less back then, the proportions of payroll allocation trending behaved in much the same way as it does currently.
B) If it was, did it yielded more equitable results?
C) Were the results as disproportionately skewed? I guess that depends on who you ask. Those of us who are Yankees or Braves fans have no gripe with the way things worked out.
Resources:
USA Today MLB salary database
Baseball-Reference (Playoff and World Series Index)
If you enjoyed this article, please consider sharing it!


Recent Comments