
Exploring some 2010 Yankee rate stats
One of the great benefits of idling in a perpetual state of infinite boredom is that one has plenty of time to try and reengage his interests. At least, this is what I tell myself. Anyway, I thought it’d be entertaining to take a look at some various Yankees rate stats from the 2010 campaign and then contrast the team collectively with the rest of the American League.
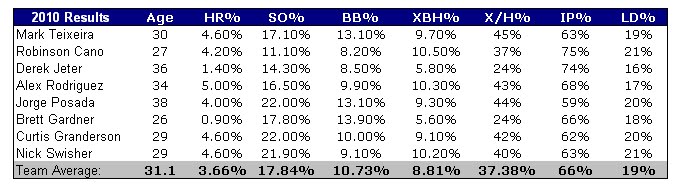
Many of these percentages shouldn’t be entirely surprising as the team collectively posted some fairly robust offensive production. Still, some of the numbers do stand out. For example, in terms of HR% (percentage of all plate appearances a home run was hit), posted the highest percentage on the team yet again. Stats like this help me digest the disgustingly lucrative contract he’s signed to and remember that a declining A-Rod is still desirable over the majority of Major Leaguers.
I wasn’t surprised to see vying for the inglorious title of New York “Strikeout King.” What did surprise me was that was seriously competing for the position (even more so than Swisher). Over Posada’s 16-year career, he’s averaged a 20% strikeout rate which is a bit worse than league average over that time span (17%). Given how prolific Posada’s been with the bat over the course of his career, that’s pretty impressive (.275/.377/.479, .856 OPS).
My favorite part of this table involves XBH% (percent of all plate appearances ending with an extra base hit). A-Rod, , and all accumulated gaudy totals. To put the percents in perspective, consider some of the game’s offensive elite. had a XBH% of 11.7%, had a 13.0%, and had a 13.1%. If Jeter could somehow regain some of his magic and match his career norm (7.20%) in 2011, we’d really be in business.
IP% represents the balls-in-play percentage. Slap-happy Derek Jeter scores highest on this one (which makes sense given his propensity to hit into double plays). For those hoping for a repeat performance from Cano in 2011, the good news is his SO% has always been fairly low (career 11%) and he’s always managed a high IP% (80%). If Robby’s plate discipline continues to improve (or even maintains status quo), the sky really is the limit for this kid.
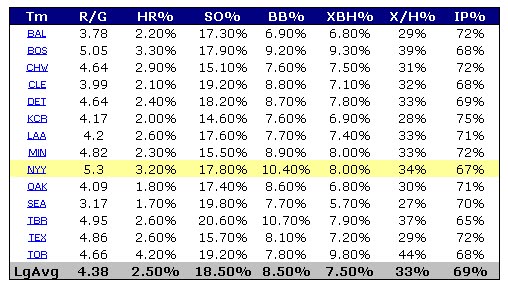
As promised, here’s how the Bombers fared collectively against the rest of the American League. Despite that final month of lackluster play during the regular season, the Yankees still managed the best R/G in the American League (just beating out their AL East rivals, the Red Sox). Scoring 5.3 runs per game will go a long way in keeping you in the game. The good news is, the Yanks should be fairly close to that total once again in 2011.
If you enjoyed this article, please consider sharing it!


0 Responses to Exploring some 2010 Yankee rate stats
Leave a Reply Cancel reply
-
LIKE TYA ON FACEBOOK
-
Recent Activity
Recent Posts
- From prospect to pitcher: The Ivan Nova story
- Montgomery = Robertson?
- Mark Teixeira Is Still Powerless (And It’s Not OK Anymore)
- Yankees getting extra strikes
- Yankees Too Old For The Young Royals, Still Win 8-3
- Game 44: Let’s Go Streaking
- Buck Has Orioles Flying High, but Can They Rule the Roost? (History Says Yes)
- For Hughes: Regression, or Improvement?
- Analyzing Hughes’ May Turnaround
- 2012 looking like 2010 for Swisher, excepting the results
Recent Comments
- on 2011 Yankees Position Preview: Second Base
- on Nova’s Curveball Key To Third Win
- bornwithpinstripes on Mark Teixeira Is Still Powerless (And It’s Not OK Anymore)
- bornwithpinstripes on Mark Teixeira Is Still Powerless (And It’s Not OK Anymore)
- on Is David Robertson really this good?
- on Pineda’s Torn Labrum, or Does the lemon law apply to baseball?
- KevinButler on Mark Teixeira Is Still Powerless (And It’s Not OK Anymore)
- Dave1955 on Mark Teixeira Is Still Powerless (And It’s Not OK Anymore)
- Eric Schultz on Yankees getting extra strikes
- Reggie C. on Mark Teixeira Is Still Powerless (And It’s Not OK Anymore)
-
Authors
Twitter
* TYA Twitter -
* EJ Fagan -
* Matt Imbrogno -
* William J. -
* Larry Koestler-
* Moshe Mandel -
* Sean P. -
* Eric Schultz -
* Matt Warden -
-
Most poker sites open to US players also provide online casinos accepting USA players. A good example of this is BetOnline.com, where you can play 3D casino games, bet on sports or play poker from anywhere in the United States.
-
Other Links
-
Blogroll
Blogs
- An A-Blog for A-Rod
- Beat of the Bronx
- Bronx Banter
- Bronx Baseball Daily
- Bronx Brains
- Don't Bring in the Lefty
- Fack Youk
- It's About The Money
- iYankees
- Lady Loves Pinstripes
- Lenny's Yankees
- New Stadium Insider
- No Maas
- Pinstripe Alley
- Pinstripe Mystique
- Pinstriped Bible
- River Ave. Blues
- RLYW
- Steven Goldman
- The Captain's Blog
- The Girl Who Loved Andy Pettitte
- The Greedy Pinstripes
- This Purist Bleeds Pinstripes
- Value Over Replacement Grit
- WasWatching
- Yankee Source
- Yankeeist
- Yankees Blog | ESPN New York
- Yankees Fans Unite
- YFSF
- You Can't Predict Baseball
- Zell's Pinstripe Blog
Writers
- Bats (NYT)
- Blogging the Bombers (Feinsand)
- Bombers Beat
- Buster Olney
- E-Boland
- Jack Curry
- Joe Posnanski
- Joel Sherman
- Jon Heyman
- Keith Law
- Ken Davidoff
- Ken Rosenthal
- LoHud Yankees Blog
- Marc Carig
- Tim Marchman
- Tom Verducci
Resources
- Baseball Analysts
- Baseball Musings
- Baseball Prospectus
- Baseball Think Factory
- Baseball-Intellect
- Baseball-Reference
- BBTF Baseball Primer
- Beyond the Box Score
- Brooks Baseball
- Cot's Baseball Contracts
- ESPN's MLB Stats & Info Blog
- ESPN's SweetSpot Blog
- FanGraphs
- Joe Lefkowitz's PitchFX Tool
- Minor League Ball
- MLB Trade Rumors
- NYMag.com's Sports Section
- TexasLeaguers.com
- THE BOOK
- The Hardball Times
- The Official Site of The New York Yankees
- The Wall Street Journal's Daily Fix Sports Blog
- YESNetwork.com
-
Site Organization
Categories
Tags
A.J. Burnett ALCS Alex Rodriguez Andy Pettitte Baltimore Orioles Bartolo Colon Boston Red Sox Brett Gardner Brian Cashman Bullpen CC Sabathia Chien-Ming Wang Cliff Lee Curtis Granderson David Robertson Dellin Betances Derek Jeter Francisco Cervelli Freddy Garcia Game Recap Ivan Nova Javier Vazquez Jesus Montero Joba Chamberlain Joe Girardi Johnny Damon Jorge Posada Manny Banuelos Mariano Rivera Mark Teixeira Melky Cabrera Michael Pineda Minnesota Twins New York New York Yankees Nick Johnson Nick Swisher Phil Hughes Prospects Red Sox Robinson Cano Russell Martin Statistical analysis Tampa Bay Rays Yankees -
Site Stats

verrry interestink! you conquer boredome well. Such simple, yet enlightening analysis. Amazing that BB and XBH should so clearly be important.