
 With all the hoopla circulating around the state of the Yankees’ 2011 relief core, I couldn’t help but reminisce about bullpen management of years past. Specifically, “WWJD?” No, I’m not referring to the preferences of a long-bearded, destined-to-suffer-for-all-mankind-and-savior-of-some Jesus; I’m talking about former Yankee skipper Joe Torre.
As we are all well aware, popular opinion suggests Torre had a propensity for systematically obliterating each ligament within the throwing appendages that were his pitchers’ arms via excessive workload early on in the season. But was that actually the case or simply another example of mainstream hyperbole? Let’s take a look at some of Torre’s favorite relievers victims and contemplate whether there’s some truth to be found here.
Note: I apologize for the complexity of the table (and all those damn numbers!), but I spent quite a while compiling the data, so now you’ll just have to suffer through it.
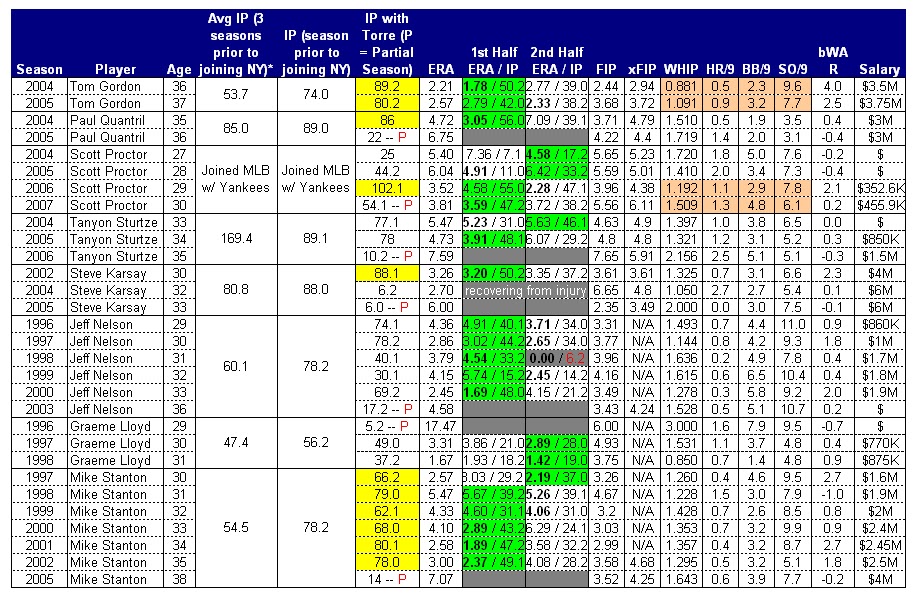
The first point to consider is simple enough to understand and the outcome is somewhat predictable; compare the innings pitched of any given reliever under Torre’s supervision against their respective prior seasons’ totals. Each reliever was fairly close to their prior year’s workload total (approximately +/- 10 innings). Interestingly, pitched quite a few more innings (35) than his combined three-season average. While this doesn’t really impact the “bullpen burnout” question, I think it’s still relevant in the sense that Torre was often criticized for leaning on particular guys too much. While that might be true to an extent in terms of general timing, over the course of the season, utilization ultimately did level out.
This point also drew my attention to Proctor’s 102.1 inning pitched total in 2006, or approximately fifty-eight more innings than he threw in 2005. Now I’m definitely not Dr. Andrews, but I’d have to assume the decision to double Scott’s workload at the ripe age of 28 was, in actuality, quite the gamble, although some might argue otherwise. In the case of Proctor’s shortened career, I can’t help but wonder if blame really does lie with Torre and Ron Guidry’s decision-making. Also, be sure to check out a related article from the fellas at Sabernomics pertaining to workloads for starting pitchers.
With that being said, perhaps more telling than overall innings pitched is innings pitched per first/second half of the season in determining reliever diminishing effectiveness. For instance, in 2004, Gordon pitched to a 1.78 ERA over the course of 50.2 innings in the first half of the season (listed as 1.78 / 50.2 in the table) and a 2.77 ERA in 39 innings during the second. When considering the table, remember that each green box represents which half season had more overall workload and whichever half-season’s ERA was lower has also been formatted in bold. Given that this is all retrospective analysis anyway, I think some of the hypothesizing can still be discussed with some sense of plausibility despite the small sample sizes.
Basically, if popular opinion stands to reason, the second half ERA should illustrate inflation (potentially dramatic at times). This expectation presumes the anticipated effects of pitcher fatigue resultant from the “Torre Effect©.” The numbers suggest that this notion isn’t entirely the case, or at the very least, isn’t quite so tangibly understood. If you exclude the partial seasons played (highlighted in gray), you’ll notice that several of the pitchers surveyed enjoyed better ERAs during the latter portion of the season in multiple years.
I think the answer is apparent. It would seem that Torre’s reputation for high workload volumes within the first half of a given season is fairly accurate. Moreover, in regard to the ERAs that improved in the second half of the season, oftentimes the total workload was less than in the first half. This set of parameters suggests to me that his pitchers may have had opportunities to improve upon first half stats due in part to additional rest. This maybe indicative of the managing staff being forced to over-compensate workload distribution after assigning a rigorous first half. In terms of the relievers themselves, ’s numbers fit this mold. On the surface, his results are actually quite counter-intuitive, as he seemed to improve down the stretch. However, in each of his seasons, his second-half innings were less numerous.
Curiously, after sustaining increased innings pitched totals, both Gordon (in 2004) and Proctor (in 2006) experienced declines in both WHIP and rate stats (highlighted in orange) during the ensuing season. Although the correlation is definitely not 100% concrete, one has to wonder if a relationship exists to some extent; in essence, this addresses the second half of the question as to whether long-term performance regression stems from Torre’s workload allocation. Common sense* Popular opinion would dictate that the answer is yes. Personally, I would think that overloading a pitcher at any age in one particular season certainly could influence one’s health, let alone statistics. I also can’t help but speculate as to whether the career outcomes might be substantially more ominous as well, but that’s a discussion for another day. (*Note: it would seem the medical community has recently begun to chime in with substantiated opinions about the adverse effects of excessive pitching on adolescents and the parallels shared with some major leaguers.)
Perhaps, in Gordon’s scenario, workload and physical stress-related regression doesn’t play a factor. By that stage in his career, he was already age 37 and could have been simply experiencing the expected physical decline and statistical regression that any player would likely undergo (and it perhaps it wasn’t exasperated by Torre at all). For a guy like Proctor, I definitely have to remain skeptical. What may be more provocative is the observation that guys like Gordon, Paul Quantrill, Proctor, and Mike Stanton (after his first campaign with
the Yankees from age 30-35) did not appear to be the same pitchers for the remainder of their careers as they were up and until Torre’s handling.
I think the conclusion that can be made here is threefold. First, natural “wear and tear” is not completely quantitative nor is the degree of stress tolerated standardized among all players. Moreover, injury is not necessarily always proportionate to workload (as enforced by the Nolan Ryan modus operandi), and can at times be entirely dictated by circumstance. Secondly, as my good friend Greg noted, no set of data can properly encapsulate the added workload derived from countless bullpen warm-up sessions – many of which don’t actually pan out in terms of the pitcher actually being used during the game.
Finally, teams take calculated risks at times. In order to best serve the team’s objectives, a player’s health will not always be a consideration. An organization may choose to “overwork” a player knowing full well that his time with the team is limited. While I feel comfortable in saying that Joe could have better managed the team’s bullpen as the numbers seem to indicate some second-half decline, I have a much harder time quantifying the actual long-term net effect on each pitcher that he is responsible for.
If you enjoyed this article, please consider sharing it!


joe has always run a bullpen into the ground , even in L.A. that was the worst thing about him as manager.