

Recently I introduced the concept of Adjusted ERA here at Yankeeist, or aERA. The statistic takes a pitcher’s actual ERA, and adjusts it to show how many runs he has given up, on average, when he is pulled from a game in the regular season. If a pitcher typically leaves the game having allowed 3 runs his aERA is 3.00.
This stat alone, however, doesn’t tell the whole story. Just as BA needs OBP or it risks obscuring what the batter is really doing, aERA requires an additional statistic that must always be presented with it if it is to accurately measure the pitcher’s performance. In the case of a starting pitcher that statistic is the number of innings he pitches on average per start, or IPGS. (I did not explain this relationship as clearly as I should have in the first post.) Now, using IPGS as well as aERA, we can better analyze the pitcher with the aERA of 3.00. If his IPGS is 7 he’s good; if it’s 6 he’s average; if it’s 5 he’s bad.
The value of these two statistics is that they combine to demonstrate precisely how much work the starting pitcher has left his bullpen and his offense if his team is going to win the game. If the pitcher’s aERA is 3.00 and his IPGS is 7.0, then the team can taste victory. If the aERA is 3.00 and the IPGS is 6.0 then there’s some work to be done, but a victory is possible. If the aERA is 3.00 and the IPGS is 5.0 there’s a problem.
Sticking with this concept, I’ve now included the bullpen, for each of the Yankee starters. I’m using graphs to demonstrate the marginal impact each pitcher has on the game. I’ve divided the ERAs of every Yankee pitcher included in the analysis by 27. This makes it possible to track the average runs the opponent has scored for any given out in the game. It also demonstrates how the probability that the opposition scores will change when a new pitcher is introduced.
For each graph below, the blue line represents the average cumulative score of the team playing against the Yankees for any given out, depending upon the pitchers who appear for the Yankees. I’ve highlighted where a reliever takes over on each graph. I’ve also taken the liberty of trying to guess the most logical order of relievers, assuming everyone is available. The red line tracks how many runs the Yankees would have scored, on average, after each of their outs in 2010. The green line tracks how many runs the median team in baseball would have scored, on average, cumulatively, after each out in 2010. Half the teams in baseball would score more runs than the green line. The other half would score fewer.
Here’s the first chart:
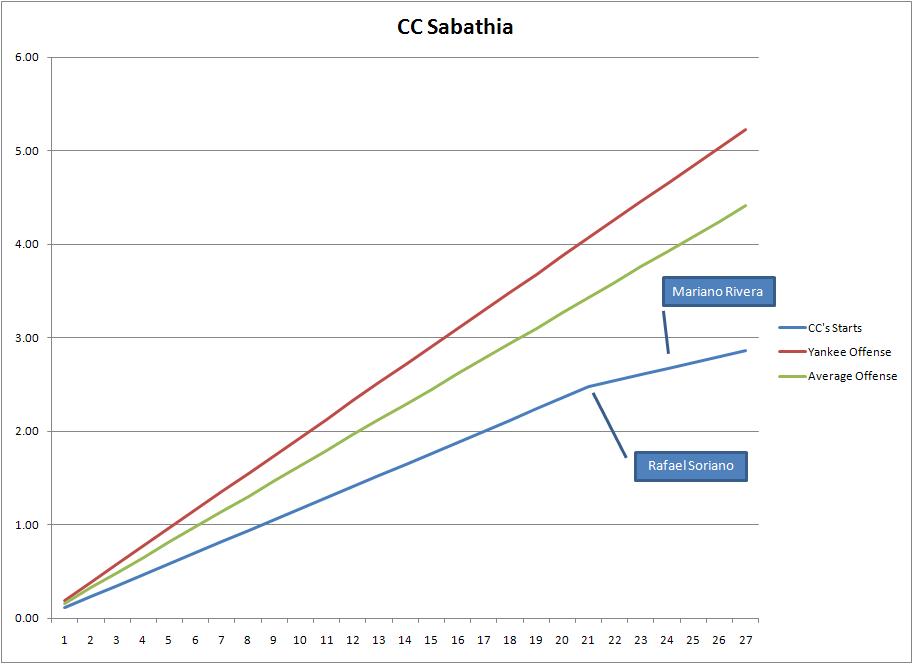
For all these charts I have assumed that the Yankees have every reliever available, so and will always enter the game. Obviously, is the starter in this scenario. One other thing is obvious: Not only should the Yankees win every game CC starts (statistically speaking) but so should just about every team in baseball. From the first pitch through the 7th inning, when CC was pulled in 2010 on average, the Yankees and the average team are beating the opposition. Soriano and Rivera just make things easier. Theoretically they don’t even need to make an appearance — they actually bend the curve downward. The opposing team had its work cut out for it enough as it was against CC. Once Soriano enters the game the probability the opposition scores actually approaches, well, zero.
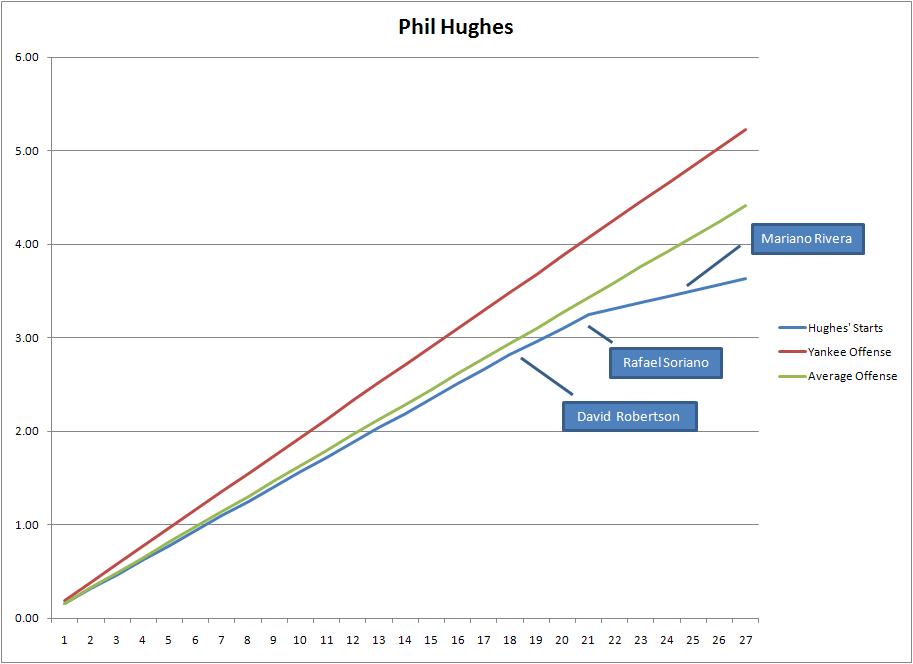
isn’t the beast CC is, but he’s still pretty good. He too left the game in 2010 giving the Yankees or the average team an excellent shot at a lead. He doesn’t last as long as CC, but he hands the ball over to , a pitcher who actually makes it a bit harder for the opposition to score in the next inning than if Hughes had stayed in the game. Odds are, either team’s offense wins the game, and the bullpen ultimately uses only three arms — not bad.
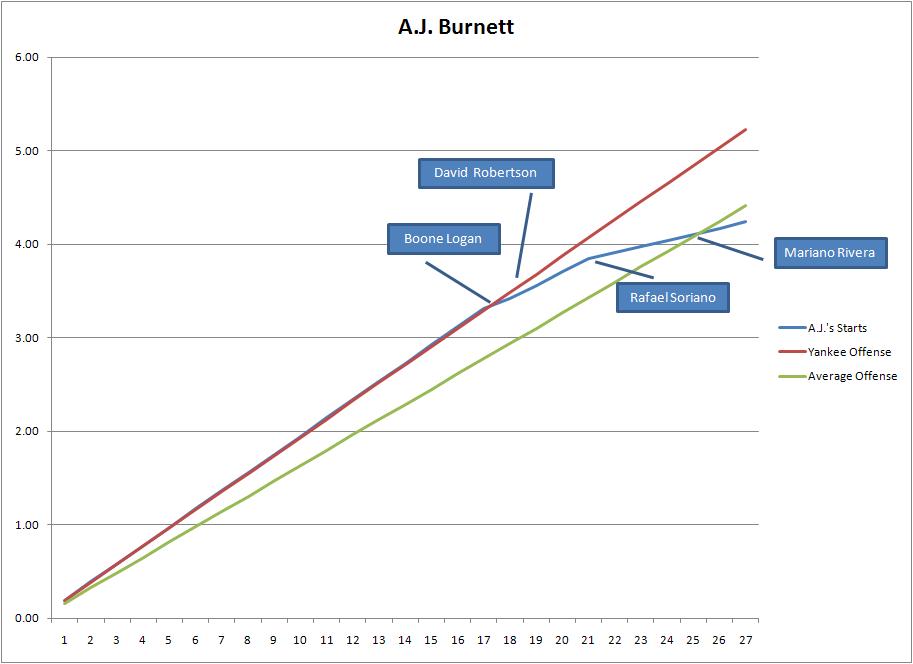
It’s true that a picture is worth a thousand words. This picture says that had a bad 2010. It also tells us that as bad as A.J. was, he was still useful on a team as good as the Yankees. He allows the other team to keep pace with the Yankee offense, which is awful when you consider that the Yankees were the best offense in baseball, but he keeps the game from getting completely out of hand. Theoretically the score is tied when he leaves the game. Speaking in terms of probability the Yankees would pull ahead once the bullpen takes over, while even an average team would pull ahead after Soriano and Rivera take over.
‘s numbers reflect only his 2010 starts, to be true to the spirit of aERA and IPGS. Here we see a pitcher who needs to be on a good team to give his offense a chance to win. He lets the average offense fall behind, but he’s serviceable on a team that can rake the way the Yankees do. It gets harder on the opposing team with each pitching change after he leaves.
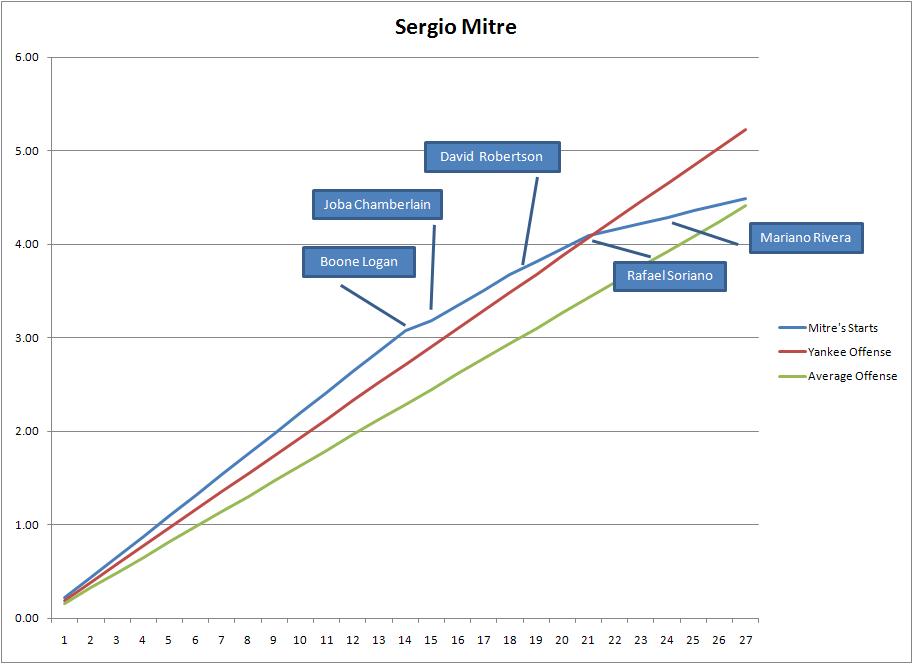
‘s stats also represent only his starts from 2010. He was bad in those starts, so bad that not even the best offense in baseball could keep pace with the runs he let the opposition score. The opposition is winning when he leaves the game. If the Yankees play to their strengths the rest of the way, on average they still have a chance to win, but in spite of Mitre, not because of his contributions.
This methodology provides an effective visual aid to the aERA and IPGS statistics, showing what the average score will be when a pitcher leaves the game, and the impact a fully available bullpen and functioning offense can have on the game moving forward. The charts also shows the minimum qualifications for a starter to be effective on the Yankees. Those qualifications are not stellar. and were both below-average starters in 2010, but they give the above-average Yankee bullpen and offense a chance to win the game anyway.
That’s why it is so surprising that the Yankees haven’t signed a mediocre arm that can be relied on for 200 innings in 2011, even with a cruddy ERA. Those kinds of arms are available, and on a team as good as the Yankees they should be sufficient, or at the very least, better than .
If you enjoyed this article, please consider sharing it!


[...] 190.2 innings of work last season over 31 starts. They were 190.2 innings of lousy work, but his aERA was 3.48 and his IPGS was 6.1. He’s actually projected to be a bit better next season but [...]