
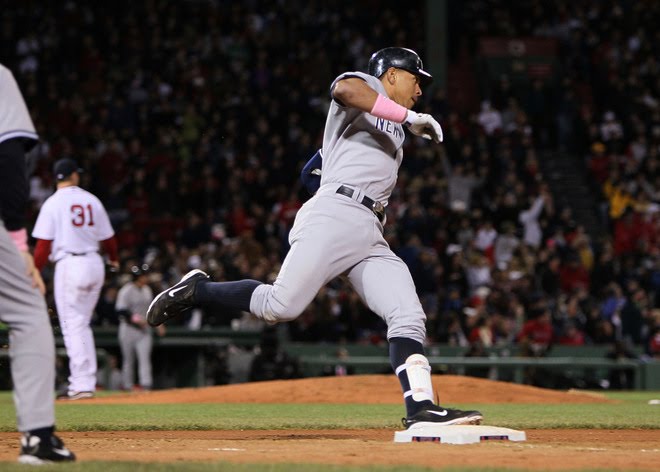
 RAB took a look at Alex Rodriguez’s contact rate last week, and though Alex has started to pick some of his numbers up during the last few games — his slash line has improved over the past four games from .253/.345/.414 to .286/.381/.464 — and his solo job vs. Boston on Sunday night was probably the happiest I’ve ever been following a home run that found the Yankees still down by four runs — I wanted to dig a bit deeper into the numbers to see if there was any reason in particular why ‘Rod’s not knocking more balls out of the park.
The below table shows historical batted ball numbers for A-Rod, his year-to-date home run totals (in this case, through the first 31 games of each season), and his season home run totals (all data c/o Fangraphs and ):

As Mike Axisa noted in the aforelinked post, A-Rod’s current fly ball percentage of 36.7% is below his career average of 39.9%, while his HR/FB ratio of 8.3% comically lags his 23.4% career rate. For the nine seasons worth of data we have available, the only time A-Rod’s HR/FB rate has ever been below 20% was 2004, a year in which he still smacked 36 home runs.
So not only is Alex hitting less fly balls than he ever has at any point during the last nine seasons, the ones he is hitting are not being hit with as much authority as usual. Clearly his HR/FB rate obviously won’t be below 10% all year, but it is a bit disconcerting that he’s at his lowest HR total through 31 games since 1995, and he wasn’t yet a full-time player at that point.
Here are the different pitch types A-Rod has seen:
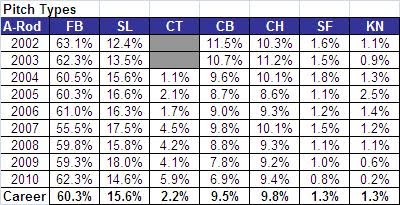
While it’s a bit tough to draw comparisons between 31 games worth of numbers and full seasons, the primary data that jumps out here is that ‘Rod is seeing less sliders and far more cut fastballs than usual. Though 5.9% is obviously still a very low percentage of all pitches seen, not only is a well-located cut fastball hard to hit in the first place, but it’s ridiculously hard to hit out of the park.
Were the fastball percentage to hold up it’d be his highest rate seen since 2003, a year in which he clubbed 47 bombs. Given his low home run totals it seems as though pitchers are more willing to challenge A-Rod with heat. I haven’t seen diminished bat speed from A-Rod, and if he continues to see more fastballs than usual it’d be great to see him start putting them where they belong.
And here are his swing percentages:
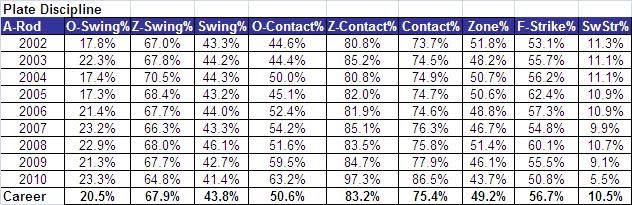
As Mike noted in his post on RAB, A-Rod is making contact with a ridiculous 97.3% of the pitches he’s swinging at in the strike zone, compared to a career average of 83.2%. As you can see, the top 10 in Z-Contact% isn’t exactly loaded with 40-home-run-power guys, and it’s odd to see A-Rod’s name up there along with league-leader Marco Scutaro, our own Brett Gardner and Juan Pierre, among other low-SLG hitters.
Alex is also swinging at more pitches out of the zone than he historically has (23.3% to 20.5% career) and less in the zone (64.8% to 67.9%). He’s also swinging at less overall pitches in general (his 41.4% rate is the lowest of the past nine seasons, compared to 43.8% career), but the ones he is swinging at he’s making crazy contact on — 63.2% contact rate on out-of-the-zone pitches (which would be a career-high) compared to 50.6% for his career, and of course, the aforementioned 97.3% contact rate at pitches in the zone. These numbers give him an overall contact percentage of 86.5%, well above his career rate of 75.4%.
He’s also seeing more balls than he ever has before (43.7% Zone%) and less first-pitch strikes (50.8%). Basically it looks like A-Rod’s not getting a ton of great pitches to swing at (5.5% Swinging Strike%), but when he is swinging he’s making arguably too much contact.
Between the relative lack of pitches in the zone he’s seeing, low number of first-pitch strikes and higher number of fastballs and cutters being thrown his way, A-Rod’s best bet is to probably utilize just a bit more of that trademark patience and wait for his pitch (though both his walk rate — 13.4% — is above his career average, his K% is significantly under, and he’s apparently seeing even more pitches per plate appearance than he usually does). I don’t know if any of the advanced statistical sites have stats on hitters’ numbers after a specific number of pitches seen in a given at-bat (I’m sure it’s out there somewhere), but I’d guess that a good percentage of A-Rod’s homers come with at least two balls in the count and four total pitches thrown.
Despite the power outage thus far, Alex is still getting his hits and taking his walks, and I’m sure we’ll all have a good laugh that Alex’s HR/FB ratio was ever as low as 8.3% once he goes off.
If you enjoyed this article, please consider sharing it!


Could've saved you many hours of labor on this one. He's not a very good hitter when he's not juicing.
Dumbest comment in blog history. Congratulations!!